
If you’re feeling a little unsure about what’s happening with home prices, that’s no surprise. Some people are saying home prices are falling, even though data proves otherwise. Part of that misconception is because people are getting their information from unreliable sources on social media and elsewhere. But it’s also coming from some media outlets misrepresenting what the data shows.
So, to keep things simple, here’s what you need to know using real data from real estate sources you can trust.
Home Price Seasonality Explained
In the housing market, some predictable ups and downs happen each year. It’s called seasonality. Spring is the peak homebuying season when the market is most active. That activity is typically still strong in the summer months but begins to turn downward as the cooler months approach.
Home prices follow along with seasonality because prices appreciate most when something is in high demand. That’s why there’s a reliable long-term home price trend. The graph below uses data from Case-Shiller to show the typical percent change for monthly home price movement from 1973 through 2022.
According to Wikipedia, the Standard & Poor’s CoreLogic Case–Shiller Home Price Indices are repeat-sales house price indices for the United States. There are multiple Case–Shiller home price indices: A national home price index, a 20-city composite index, a 10-city composite index, and twenty individual metro area indices. These indices were first produced commercially by Case Shiller Weiss. They are now calculated and kept monthly by Standard & Poor’s, with data calculated for January 1987 to the present. The indices kept by Standard & Poor are normalized to a value of 100 in January 2000. They are based on original work by economists Karl Case and Robert Shiller, whose team calculated the home price index back to 1990.
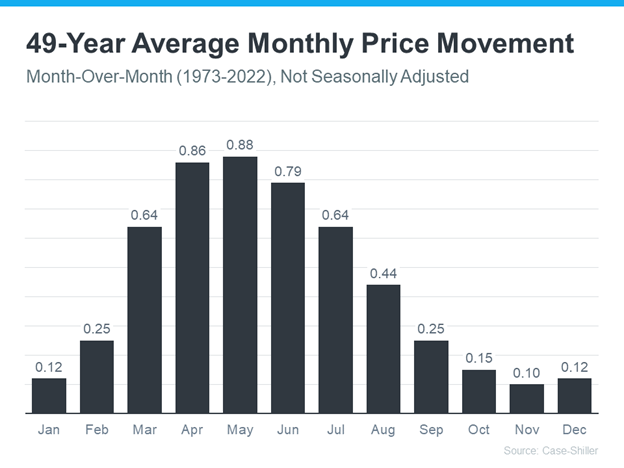
As the data shows, at the beginning of the year, home prices grow, but not as much as they do when entering the spring and summer markets. That’s because the market is less active in January and February since fewer people move in the cooler months. As the market transitions into the spring, there are more homebuyers and home prices go up a lot more in response. Then, as fall and winter approach, prices still grow, just at a slower pace as activity eases again.
Seasonality Has Returned
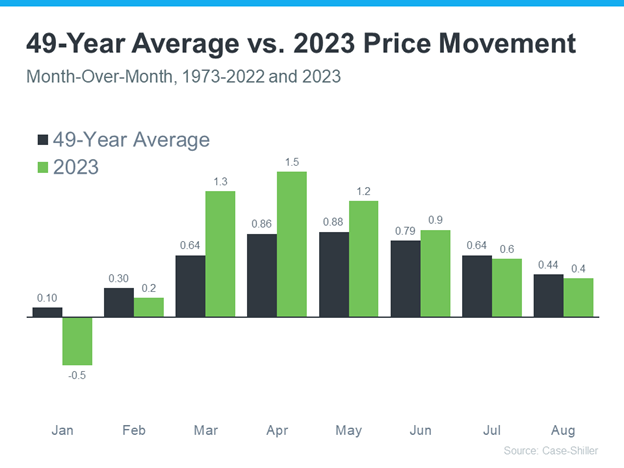
The graph below shows how this year compares to the long-term trends. Here’s the latest data for this year from Case-Shiller. Just like before, dark bars are a long-standing trend. The green bars represent what’s happened this year. As you can see, the green bars are beginning to fall in line with what’s normal for the market. That’s a good thing because it’s more sustainable price growth than we’ve seen in recent years.
Nationally prices are not falling, the price growth is beginning to normalize. Turn to reliable sources like Case-Shiller for the latest updates on the real estate market. The data included here gives you the context you need to understand what is happening. So, if you see something in the headlines that is confusing, don’t take it at face value. Ask a trusted real estate professional at Wenzel Select Properties for more information.
Remember, it’s normal to see home price growth slow down in the winter months. And that doesn’t mean home prices are falling. They’re just rising at a more moderate pace. If you have questions about what’s happening with prices in Downers Grove or your community, let’s connect. Give us a call at 630.430.4790.